Glenwood Springs, CO
Real Estate Market Report
Last Update: March, 24, 2026
Latest available housing data: February 2026
Glenwood Springs, CO, Real Estate Market Snapshot
Latest Available Data: February 2026
Active inventory:
36
Closed sales:
7
Median $/sq ft:
$409.6
Median DOM:
95
Median sale price:
$564,000
Months of supply:
3.7
Market posture:
Seller-leaning
Glenwood Springs Real Estate Market Overview (March 2026)
The Glenwood Springs real estate market is entering the year with a mix of improving activity and increased friction, where rising sales and stable inventory are occurring alongside longer transaction timelines and continued pressure on pricing. To understand how Glenwood Springs compares to other locations in Colorado, explore our luxury real estate market guide.
Inventory levels have remained relatively stable, with only slight increases compared to the previous month and modest declines year-over-year. This suggests that while supply is not expanding significantly, it remains sufficient to create more balanced conditions compared to more constrained markets.
At the same time, transaction volume has increased both month-over-month and year-over-year, indicating that buyers are actively engaging in the market. Demand remains present, particularly for properties that align with price expectations and local lifestyle appeal.
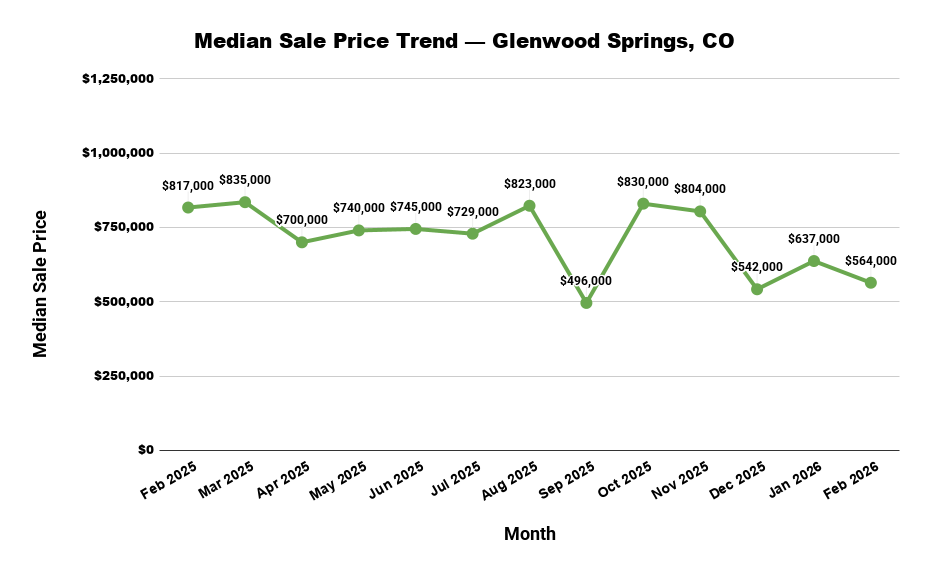
Pricing trends show a more nuanced picture. Price per square foot has increased in the short term, suggesting some resilience in buyer demand, while the median sale price has declined significantly compared to last year. This reflects a shift in market composition and a greater sensitivity to pricing at the transaction level.
Days on market have increased sharply, indicating that homes are taking significantly longer to sell. This points to a more deliberate buyer pool, where decisions are taking more time and pricing alignment plays a critical role in closing transactions. Positioned between lifestyle markets and luxury destinations like Aspen, Glenwood Springs attracts a different segment of buyers.
With approximately 3.7 months of supply, the Glenwood Springs housing market continues to lean toward sellers. However, the extended time on market suggests that leverage is becoming more situational, depending on pricing and property positioning.
Overall, the Glenwood Springs real estate market is defined by active demand combined with slower execution. Buyers are present but selective, while sellers must navigate a market in which timing and price alignment are increasingly important. This Glenwood Springs real estate market report reflects current housing trends, pricing behavior, and supply conditions shaping the local market.
From our perspective, Glenwood Springs is currently operating in a market where demand remains steady, but transactions require more time and precision, creating a more measured and negotiation-driven environment.
If you’re evaluating opportunities in Glenwood Springs, we can walk you through how these trends apply to specific properties and neighborhoods.
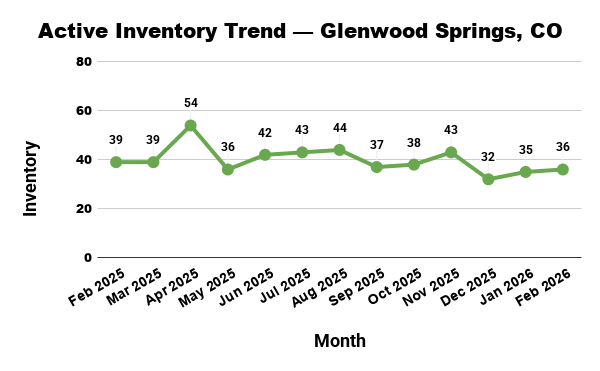
Inventory Trends
Active Listings: 36
Month-over-month change: +2.9%
Year-over-year change: -7.7%
6-month average: 37
Current trend: Stable
Inventory in Glenwood Springs has remained relatively stable, with only slight movement compared to recent months.
While levels are modestly lower than last year, they are closely aligned with the six-month average, suggesting a market that is not experiencing significant shifts in supply.
This stability contributes to a more balanced environment compared to highly constrained markets.
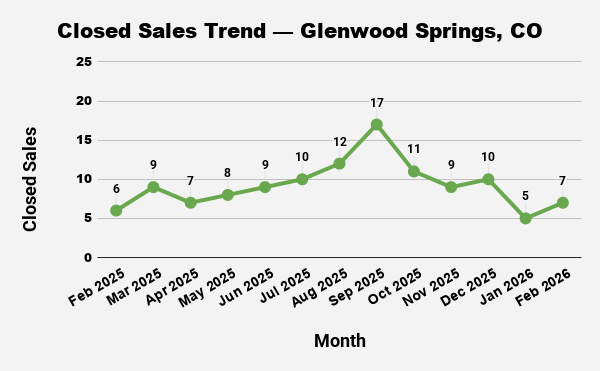
Sales Activity
Closed Sales (Monthly): 7
Month-over-month change: +40.0%
Year-over-year change:
+16.7%
6-month average: 10
Current trend:
Increasing
Transaction volume has increased both month-over-month and year-over-year, indicating continued buyer engagement.
While total sales remain below the six-month average, the upward trend suggests that demand is present and responsive to current conditions.
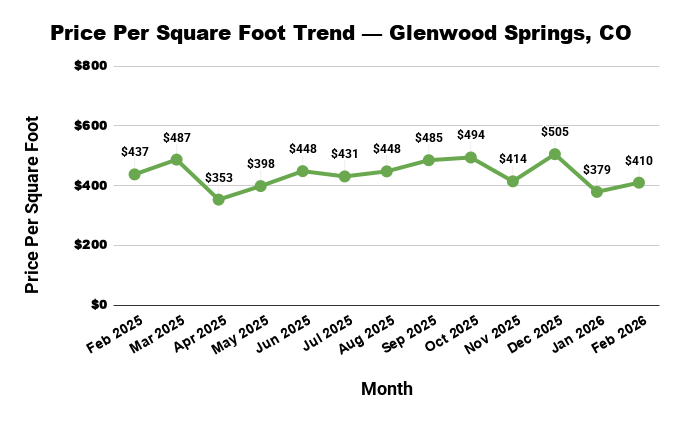
Price Per Square Foot
Median Price Per Sq Ft: $409.6
Month-over-month change: +8.1%
Year-over-year change: -6.4%
6-month average: $448
Current trend:
Increasing
Price per square foot has shown short-term strength, suggesting resilience in buyer demand for well-positioned properties.
However, values remain below last year’s levels, indicating that pricing has not fully recovered across all segments.
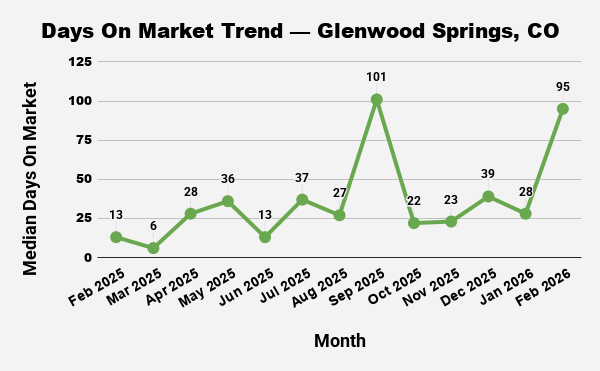
Days on Market
Median Days on Market: 95
Month-over-month change:
+239.3%
Year-over-year change:
+630.8%
6-month average: 51
Current trend: Increasing
Homes are taking significantly longer to sell than in recent months and last year.
This sharp increase in days on market indicates a more deliberate and cautious buyer pool, where transactions require more time and alignment to move forward.
Median Sales Price
Median Sale Price: $564,000
Month-over-month change:
-11.5%
Year-over-year change: -31.0%
6-month average:
$645,500
Current trend: Decreasing
Median sale price has declined compared to both last month and last year, reflecting ongoing pricing pressure across the market.
This suggests that buyers are increasingly focused on value and are less willing to engage at higher price points without clear alignment.
Housing Supply
Months of Supply: 3.7
Market posture:
Seller-leaning
Method:
Inventory divided by 6-month average monthly sales
Supply levels remain relatively tight, indicating a market that still leans toward sellers.
However, the extended time on market suggests that leverage is not uniform and depends heavily on pricing accuracy and property positioning.
What This Means for Buyers
For buyers entering the Glenwood Springs real estate market, current conditions present both opportunities and a need for patience.
Inventory remains relatively stable, and longer days on market provide more time to evaluate properties than in faster-moving markets.
At the same time, pricing adjustments in certain segments may create opportunities to find value, particularly for properties that have been on the market longer.
Buyers who approach the market with a clear strategy and a willingness to evaluate opportunities carefully will be best positioned to succeed.
What This Means for Sellers
For sellers, the Glenwood Springs housing market remains active, but outcomes increasingly depend on timing and pricing alignment.
While buyer demand is present, the increase in days on market indicates that transactions are taking longer to materialize.
Homes priced accurately and positioned effectively continue to sell, while those misaligned with current expectations may experience extended exposure.
Sellers who approach the market with realistic expectations and a clear strategy will be best positioned to achieve strong results.
Data Methodology
Market statistics are compiled from publicly available housing market datasets, including regional housing reports and aggregated market data, and reflect the most recent available monthly data. Because housing market reporting often lags by several weeks, the most recent month shown typically represents activity from the previous reporting cycle.
Glenwood Springs Real Estate Market FAQs
Is Glenwood Springs currently a buyer’s or seller’s market?
Glenwood Springs is currently a seller-leaning market, with approximately 3.7 months of supply. However, conditions vary depending on pricing and property positioning.
Are home prices rising in Glenwood Springs?
Home prices have declined year-over-year, indicating pricing pressure, although short-term signals such as price per square foot show some resilience.
When is the busiest time for the Glenwood Springs housing market?
The market is typically most active during the spring and summer months, when inventory increases, and buyer activity picks up.
What types of homes are most competitive in Glenwood Springs?
Homes that are well-located, updated, and aligned with lifestyle preferences, such as proximity to outdoor recreation, tend to perform best in the market.