Boulder, CO
Real Estate Market Report
Last Update: March, 23, 2026
Latest available housing data: February 2026
Boulder, CO, Real Estate Market Snapshot
Latest Available Data: February 2026
Active inventory:
400
Closed sales:
62
Median $/sq ft:
$505.7
Median DOM: 50
Median sale price:
$807,000
Months of supply:
5.4
Market posture:
Seller-leaning
Boulder Real Estate Market Overview (March 2026)
The Boulder real estate market is entering the year in a rebalancing phase, where increasing inventory, rising transaction activity, and faster-moving properties are occurring alongside softer pricing trends. Discover how Boulder compares with the rest of the state, and explore our Colorado real estate market guide.
Inventory has expanded meaningfully compared to the previous month and now sits above recent averages. This introduces greater optionality into a market that has historically been constrained, giving buyers more room to evaluate opportunities across price points and property types.
At the same time, transaction volume has increased month over month, signaling renewed buyer engagement. While activity remains slightly below last year’s levels, the recent rise suggests that demand is still present and responsive to current market conditions.
Pricing trends are showing a more complex shift. Unlike more exclusive markets such as Cherry Hills Village, Boulder tends to reflect a broader mix of buyer demand and property types. Median sale price and price per square foot remain down year-over-year, reflecting a normalization following prior pricing peaks. However, short-term movement in price per square foot indicates that demand for well-positioned properties remains intact.
Days on market have decreased significantly, pointing to faster movement for homes that align with buyer expectations. This suggests that while pricing is adjusting in certain segments, properties that are priced correctly and positioned well are still attracting strong interest.
With approximately 5.4 months of supply, the Boulder housing market continues to lean toward sellers, though conditions are becoming more balanced. Boulder’s structural constraints, including limited land availability and consistent lifestyle-driven demand, continue to support competitive dynamics even as inventory rises.
Overall, the Boulder real estate market is defined by selectivity rather than slowdown. Buyers are active, but increasingly discerning, while sellers who position their properties accurately continue to benefit from underlying demand. This Boulder real estate market report reflects current housing trends, pricing behavior, and supply conditions shaping the local market.
From our perspective, Boulder continues to operate as a highly competitive, lifestyle-driven market where demand remains consistent, but pricing performance is increasingly tied to property quality, location, and presentation.
If you’re evaluating opportunities in Boulder, we can walk you through how these trends apply to specific properties and neighborhoods.
Compare Nearby Colorado Markets
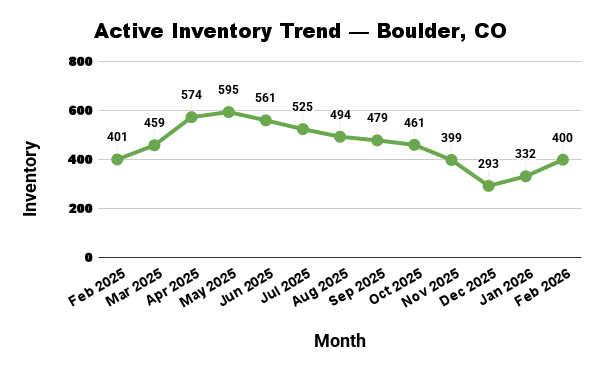
Inventory Trends
Active Listings: 400
Month-over-month change:
+20.5%
Year-over-year change:
-0.2%
6-month average: 377
Current trend: Increasing
Inventory in Boulder has increased meaningfully compared to last month and now sits above recent averages.
This rise increases availability in a market that has historically remained constrained, giving buyers additional options across price points and property types.
While year-over-year levels remain relatively stable, the recent upward movement signals a shift toward greater optionality and a more balanced competitive landscape.
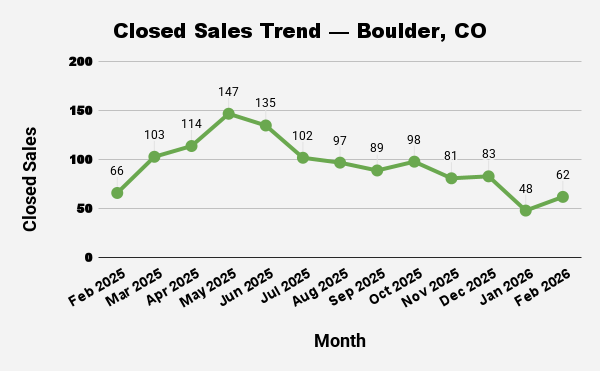
Sales Activity
Closed Sales (Monthly): 62
Month-over-month change: +29.2%
Year-over-year change: -6.1%
6-month average: 74
Current trend: Increasing
Transaction volume has increased notably compared to the previous month, indicating renewed activity and buyer engagement.
While sales remain slightly below last year’s levels, the month-over-month growth suggests that demand is still present and responsive to current market conditions.
This combination of rising inventory and increasing sales points toward a market that is active, but becoming more selective rather than overheated.
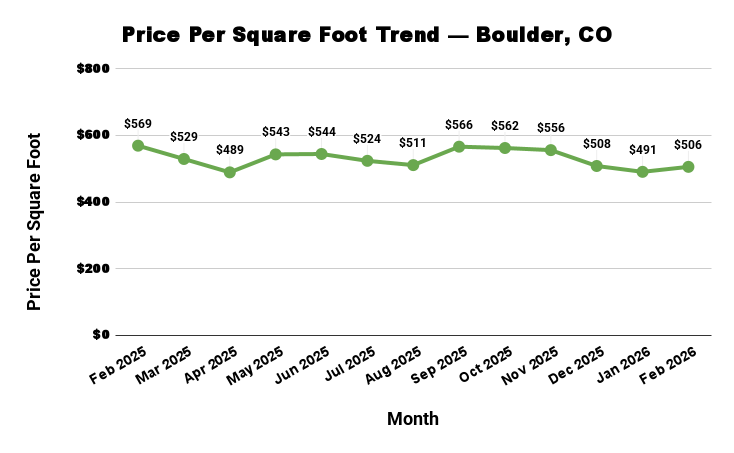
Price Per Square Foot
Median Price Per Sq Ft: $505.7
Month-over-month change: +3.0%
Year-over-year change: -11.2%
6-month average: $532
Current trend: Increasing
Price per square foot has shown short-term upward movement, signaling resilience in current buyer demand, particularly for well-positioned properties.
However, values remain below last year’s levels, reflecting a broader normalization following prior pricing peaks.
This indicates a market where pricing strength is returning in select segments, rather than across all property types.
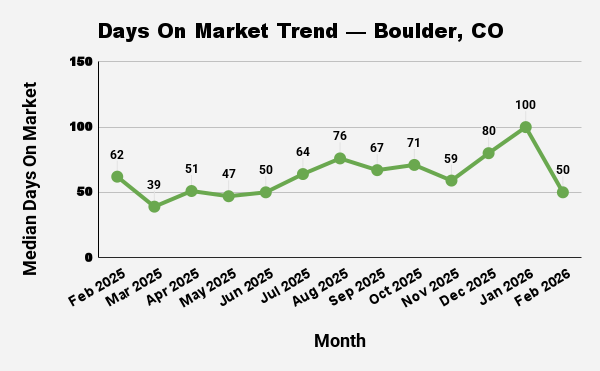
Days on Market
Median Days on Market: 50
Month-over-month change: -50.0%
Year-over-year change:
-19.4%
6-month average: 71
Current trend:
Decreasing
Homes are selling significantly faster than in recent months and last year, indicating strong buyer responsiveness to well-positioned listings.
This reduction in days on market suggests that while pricing may be adjusting, demand for desirable properties remains highly active.
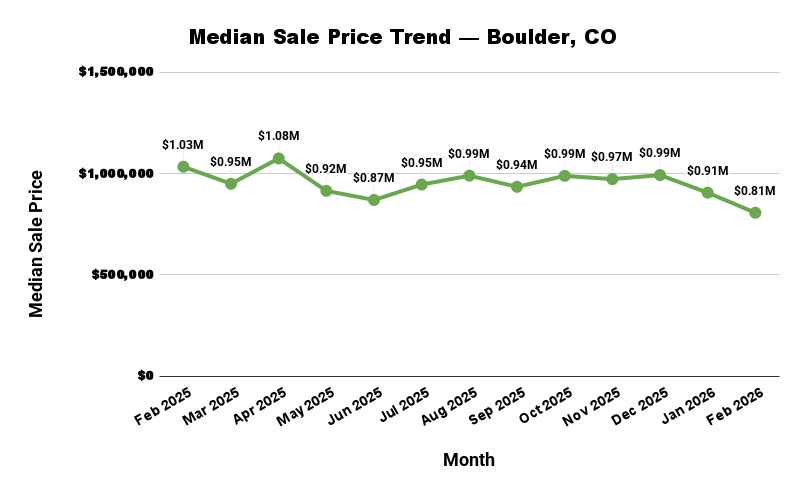
Median Sales Price
Median Sale Price: $807,000
Month-over-month change: -10.9%
Year-over-year change:
-22.0%
6-month average:
$933,833
Current trend: Decreasing
Median sale price has declined both month-over-month and year-over-year, reflecting a shift in market composition and potential softening across certain segments.
Rather than indicating broad depreciation, this trend suggests that pricing is becoming more segmented, with stronger performance concentrated in properties that align closely with buyer expectations.
Housing Supply
Months of Supply: 5.4
Market posture: Seller-leaning
Method: Inventory divided by 6-month average monthly sales
Current supply levels indicate a market that continues to favor sellers, though conditions are becoming more balanced compared to prior periods.
While inventory has increased, Boulder’s structural constraints and consistent demand continue to support competitive dynamics.
The result is a market where sellers still have leverage, but buyers have more flexibility than in previous cycles.
What This Means for Buyers
For buyers entering the Boulder real estate market, current conditions offer a more balanced and opportunity-driven environment than in previous years.
Inventory has increased, providing more options and allowing buyers to approach the market with greater intention rather than reacting to limited availability. At the same time, recent increases in transaction activity and faster days on market indicate that well-positioned homes are still moving quickly.
Pricing trends may present opportunities in certain segments, particularly where properties are not fully aligned with current buyer expectations. However, homes that offer strong location, condition, and lifestyle appeal continue to attract attention and can move decisively.
Buyers who understand where value exists within the market and remain prepared to act when the right opportunity presents itself will be best positioned to navigate Boulder effectively.
What This Means for Sellers
For sellers, the Boulder housing market remains favorable, but success is increasingly tied to precision in pricing and presentation.
While inventory has increased, demand remains strong, particularly for properties well-positioned in the market. Homes that align with buyer expectations for location, condition, and overall appeal continue to sell quickly.
At the same time, broader pricing trends indicate that not all properties are performing equally. Overpricing or misalignment with current market conditions may result in extended exposure and reduced buyer engagement.
Sellers who approach the market with realistic expectations and a clear understanding of how their property fits within the current landscape are best positioned to achieve strong outcomes.
Data Methodology
Market statistics are compiled from publicly available housing market datasets, including regional housing reports and aggregated market data, and reflect the most recent available monthly data. Because housing market reporting often lags by several weeks, the most recent month shown typically represents activity from the previous reporting cycle.
Boulder Luxury Real Estate Market FAQs
Is Boulder currently a buyer’s or seller’s market?
Boulder is currently considered a seller-leaning market, with approximately 5.4 months of supply. However, increasing inventory and more balanced conditions are giving buyers additional flexibility compared to previous periods.
Are home prices rising in Boulder?
Home prices in Boulder have declined year-over-year, reflecting a broader market recalibration. That said, pricing performance varies by segment, with well-positioned properties continuing to show resilience.
When is the busiest time for the Boulder housing market?
The Boulder housing market is typically most active during the spring and early summer months, when inventory increases, and buyer activity accelerates.
What types of homes are most competitive in Boulder?
Homes that are well-located, updated, and aligned with Boulder’s lifestyle appeal, such as proximity to outdoor recreation, walkability, and views, tend to attract the most competition and sell more quickly.